
In addition to using Gasology’s API tools designed to gather tank inventory levels, users can manually adjust inventory via the forecasting tool. You can access the forecasting window by clicking on the Forecasts tab below the inventory bar chart.
This table contains the actual values used in the inventory bar chart organized on a daily basis. A field for Daily consumption rate is also provided.
Use the pencil icon to adjust inventory levels (the dark blue bars) on historical dates. An existing adjusted inventory bar can also be click-dragged up or down to change the value.
Manually Adjusting Inventory
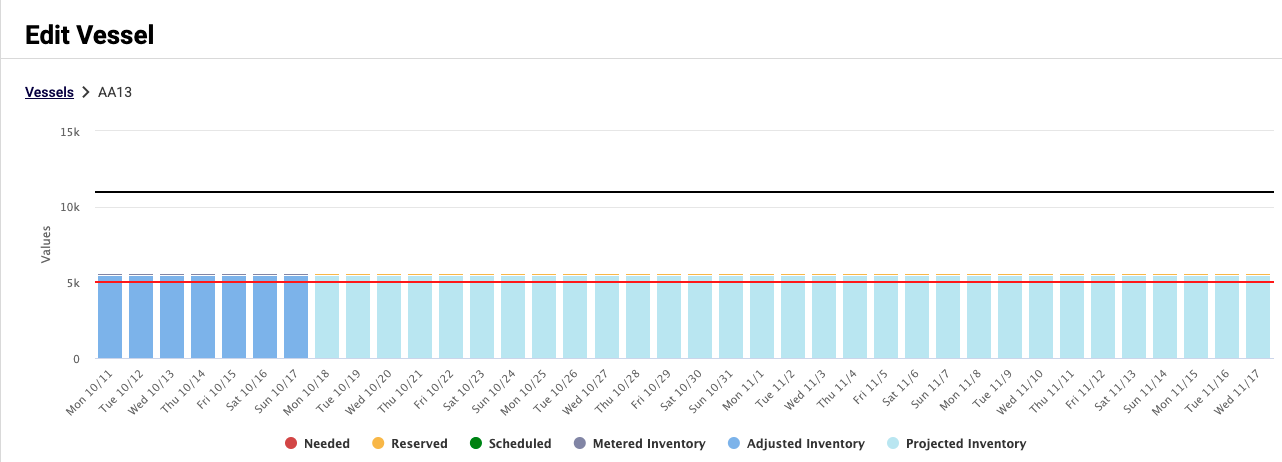
In the absence of metered values or an API connection, the system will default to a flat line at half of the vessel’s capacity for both adjusted and projected values. Click-dragging the bars in the chart or using the Forecasts tab table to edit will change the value for that day. This will cause the chart to update immediately based on the updates that have been made.
Users are advised to adjust all 7 prior days to a close-as-possible estimate of actual inventory levels per day. This will create the most accurate daily consumption rate and projected data.
Adjusting the Daily Consumption Rate
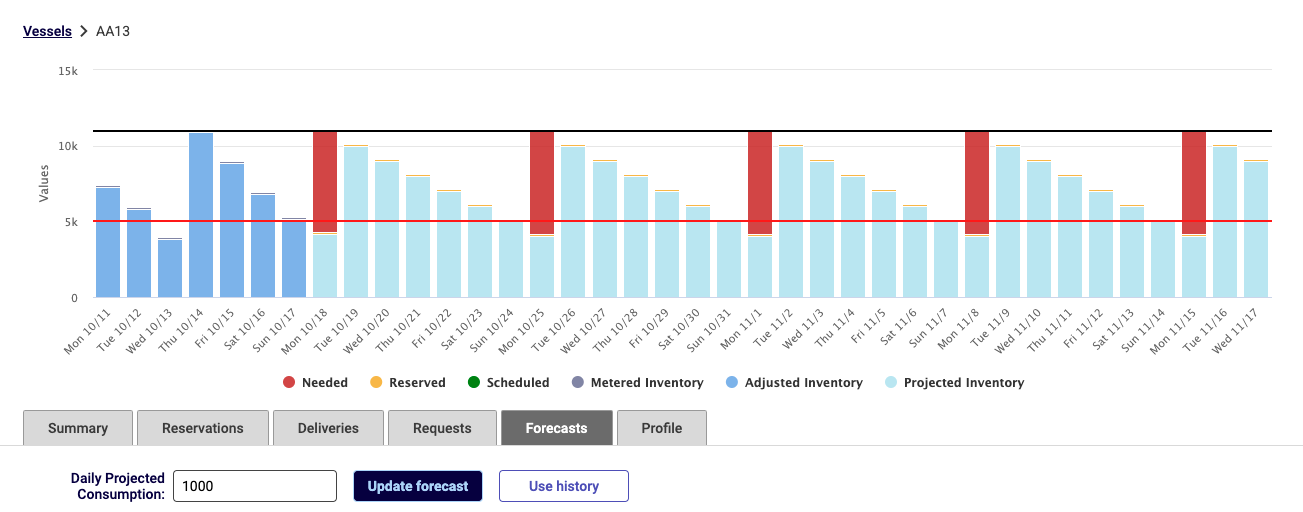
Users can update the daily consumption rate to alter future projected data. This will create an accurate visualization of future purchasing needs.
To use a manual consumption rate, type the desired rate in the Daily Consumption Rate input field, then press the “Recalculate” button. Users can change the rate and re-update as much as they want, to see what their future needs would look like in a variety of settings.
After updating the projection based on a manual rate, users can return to using the computed rate by clicking the “Apply” button.
Note: A manual daily consumption rate will not be saved to the database and will need to be re-entered each session. Otherwise, the daily consumption rate will default back to the actual consumption.
Purchasing Needed Gallons
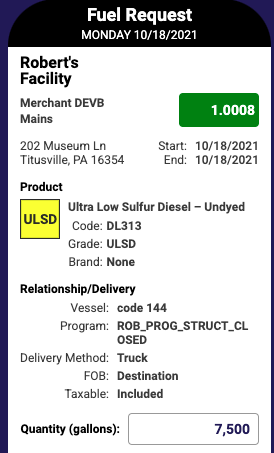
“Needed” gallons are represented by any bars that are colored red. To purchase needed gallons, click the red bar in the chart. This will automatically direct you to the Find Fuel screen for the selected vessel. Select a price that meets your needs to begin checkout.
The quantity reserved will default to 7,500 gallons but can be modified if required. Once you proceed through the normal purchasing workflow and the transaction is confirmed, the area previously shown as needed in the vessel inventory chart will now show as Reserved (yellow) or Scheduled (green).
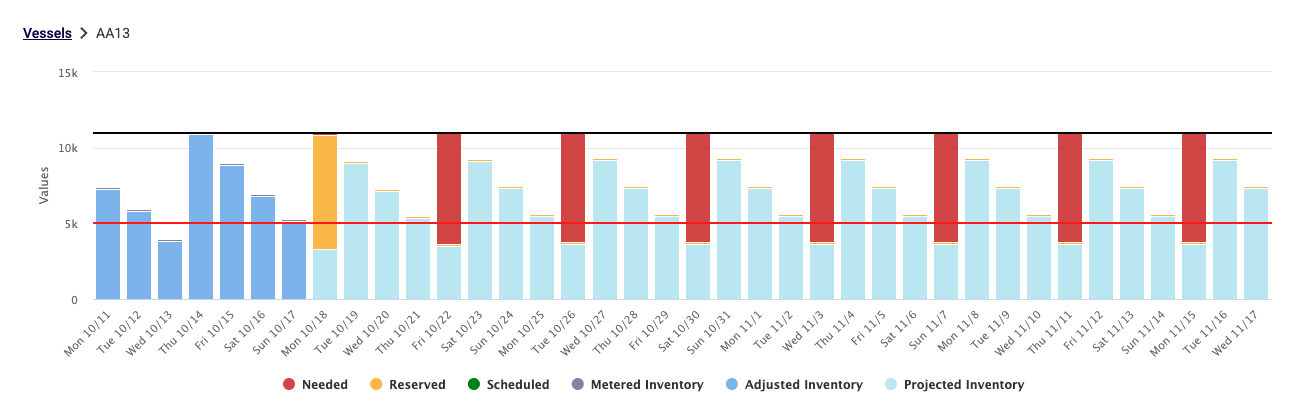
Note: The way ordered gallons are shown in the chart differs for daily reservations vs. monthly reservations. Because daily reservations are only valid for a one-day period, all the gallons for those reservations are added as Ordered items to that day on the chart.
For monthly reservations, the reserved gallons replace only the estimated needed gallons that can be covered. For example, if the chart predicts needed gallons of 7,500 on the 1st, 7th, 14th, and 21st of October, and the business consumer has reserved 28,000 gallons for the month of October, the user should see 7,500 gallons for the 1st, 7th, and 14th as “Ordered.” On the 21st, they should see 5,500 gallons Ordered and 2,000 gallons as needed.